
Our Pandemic Gap Paper is out!
In a multidisciplinary effort across many labs within the Mount Sinai Health System, we analyzed over 3 million viral tests collected between 2019 and 2025 to see how common respiratory viruses behaved before and during the COVID‑19 pandemic. We tracked SARS‑CoV‑2 plus eight other viruses including influenza, RSV, seasonal coronaviruses, parainfluenza, among others.
Here are some of our key findings:
The COVID‑19 Pandemic temporarily changed how many respiratory viruses circulated, with many familiar respiratory viruses suddenly disappearing for months to years.
The viruses disappeared likely for the following reasons:
Public health measures such as masking, social distancing, school/business closures, and reduced travel.
Widespread SARS‑CoV‑2 infection may have activated broad, general antiviral immune responses, temporarily protecting people from other viruses. Something similar to what scientists call “trained immunity.”
When viruses came back, they returned off‑schedule and some did not follow normal seasonal patterns. The long gap in virus circulation may have downstream effects, including:
Children born between 2020–2023 may have altered immune “imprinting” because they weren’t exposed to typical viruses during crucial early years.
Populations could be more susceptible to future outbreaks, since immunity to common viruses was not regularly boosted.
Check out Figures 1 and 2 from the paper below and read our manuscript here!
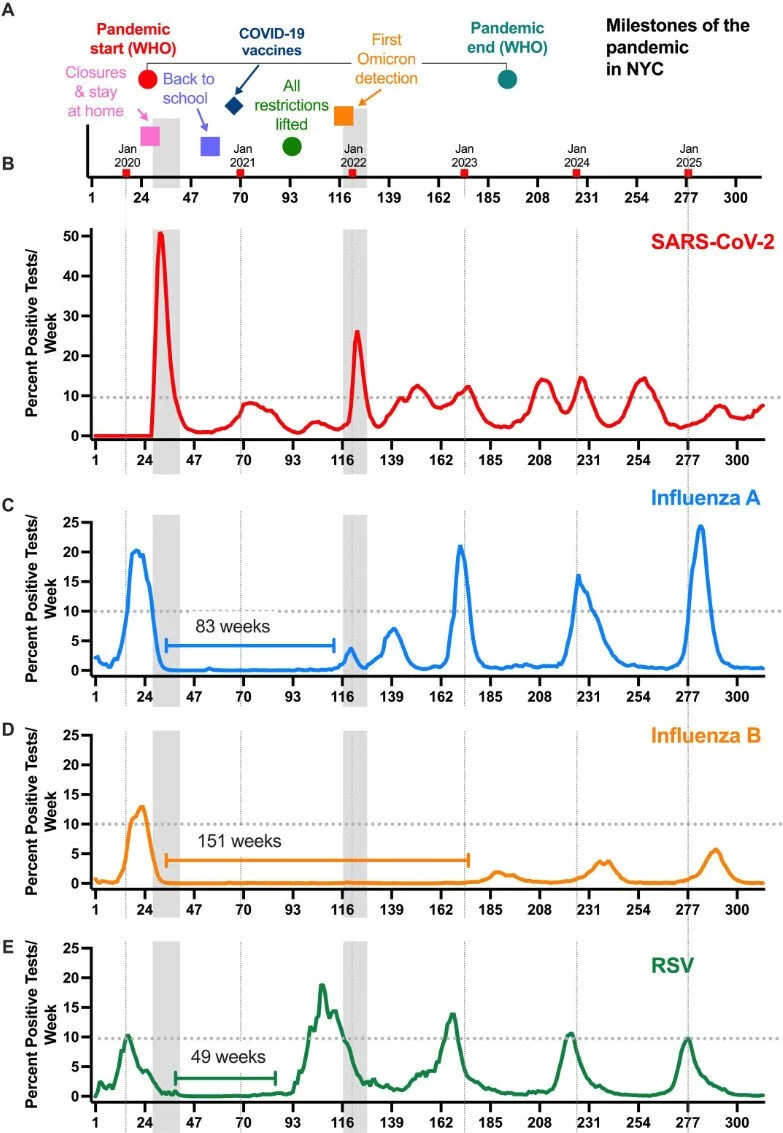
Fig 1 The circulation of influenza A virus, influenza B virus, and RSV was absent for extended durations following the initial wave of SARS-CoV-2 infections in March of 2020 in NYC. (A) Key dates specific to the COVID-19 pandemic in NYC are shown with the gray vertical bars identifying the first wave as well as the Omicron wave, both of which swept the metropolitan area. The beginning of each calendar year is indicated by vertical dotted lines in each panel. The dotted horizontal line in each plot indicates the 10% test positivity rate. Numbers of positive tests per week for SARS-CoV-2 (B; N positive tests: 123,675), influenza A virus (C; N positive tests: 31,131), influenza B virus (D; N positive tests: 6,982), and RSV (E; N positive tests: 14,467) are shown (312 weeks, 2019–2025). During this time, the test positivity for SARS-CoV-2 never dipped below 0.5%. The length of time a given virus remained undetected (under 0.5% frequency for two consecutive weeks) is shown by the bracket line. Frequency counts in the panels are smoothed using an exponentially weighted window with a span of 4.
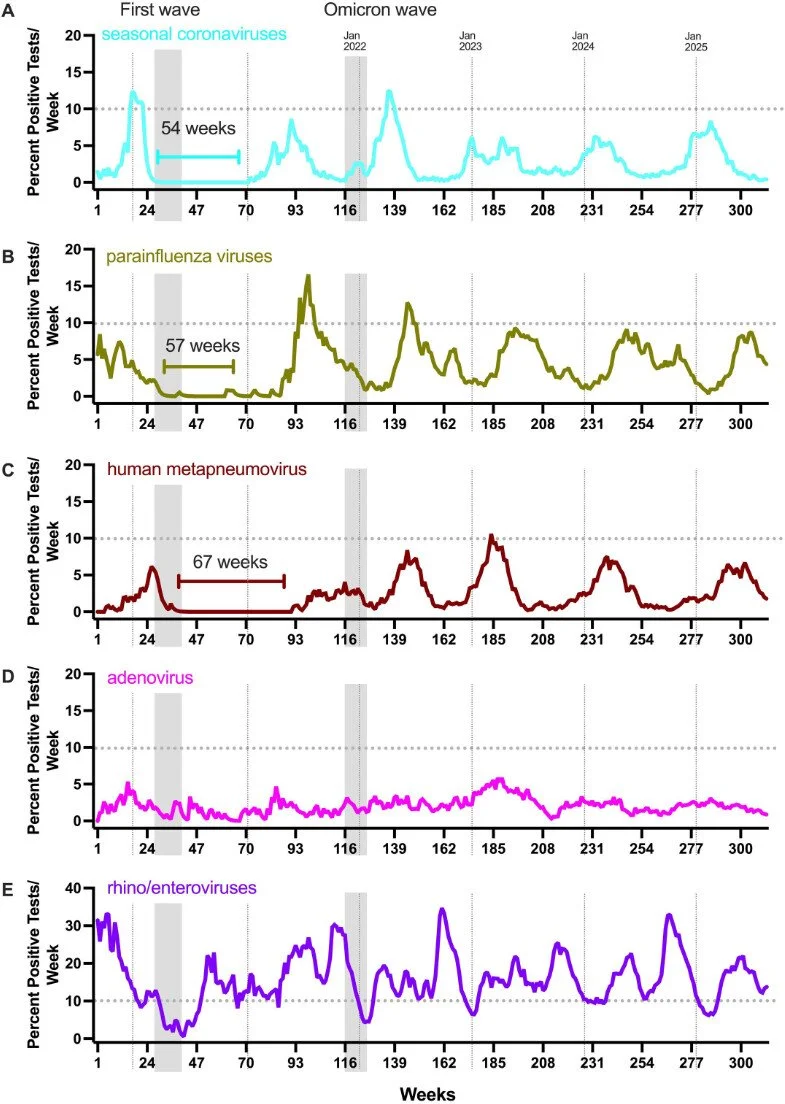
Fig 2 The circulation of seasonal coronaviruses (sCoVs), parainfluenza viruses (PIVs), and human metapneumovirus (HMPV) was absent for extended durations following the initial wave of SARS-CoV-2 infections in March of 2020 in NYC. The gray vertical bars identify the first wave as well as the Omicron wave (same as in Fig. 1), and the dotted vertical lines identify the beginning of each calendar year. The dotted horizontal line in each plot indicates the 10% test positivity rate. Numbers of positive tests per week for sCoV (A; N positive tests: 2,377), PIV (B; N positive tests: 3,599), HMPV (C; N positive tests: 2,398), adenoviruses (D; N positive tests: 1,825), and RH/EV (E; N positive tests: 13,650) are shown (Biofire Respiratory Panels 2.0 and 2.1, 312 weeks, 2019–2025). The length of time a given virus remained undetected (under 0.5% frequency for two consecutive weeks) is shown by the bracket line. Frequency counts in the panels are smoothed using an exponentially weighted window with a span of 4.